Showing posts with label Adobe Spark. Show all posts

Wednesday, April 17, 2019

These Documentaries Are KILLER!

We are led by example. 

Think about it: Have you ever... Put together a puzzle without first looking at the cover to see what it's supposed to look like once complete? Made a craft or home improvement project without first looking up inspiration or instructions on Google or Pinterest? Saw a movie without watching the trailer or reading the synopsis? The answer is mostly likely no, as we are driven by seeing something that we can connect with.

Because of this need for inspiration to draw from and even deviate from, it is often challenging to ask our students to create - the highest level of Bloom's - without giving them any sort of frame of reference. Couple that with asking students to use a new tech tool, conduct a research project on an unknown individual, and apply taught curricular concepts to a new creation may feel daunting for even our traditionally higher performing students. 

Recognizing all of these factors, Becky Ainsworth - Forensics Science teacher at Byron Nelson High School, created multiple resources to set her students up for success. Students in this upper level class were tasked with creating a mini-documentary that detailed the forensic psychology of an infamous serial killer, and were to present the information in a video format using Adobe Spark to make it view like a true documentary. 

Click to view Mrs. Ainsworth's Spark Project Instructions.
In previous years, students presented this content in a traditional format by standing in front of the class and retelling their information. This type of presentation lacked student engagement, was time consuming, and the success of a exemplar product was confined to that class periods' limited audience. To elevate this experience, Becky then replaced the traditional presentation format with the documentary style project requirement. With any first year project, there aren't a bank of examples to pull from, so it was a genius idea that Mrs. Ainsworth created and delivered the project instructions using the exact tool, Adobe Spark Video, she was asking students to use. Additional relevant information, including required content and the grading rubric, were showcased on a traditional document project outline.

Next, students were empowered with full creative freedom to add content from any reliable source (with a minimum of at least 3) as they conducted their own research. The documentary is a visual, video presentation, so the main premise requires a series of photos and videos that have a voice-over to tell the story using very little, if any, text on screen. Students used sites such as Pixabay to find free stock photo and video clips, as well as truly realistic clips that depicted the actual serial killer in photo or video. Check out these top two mini-documentary creations:

Ian Brady: As told by Lauren
Jeffrey Dahmer: As told by Kai and Tony

Once video creation was complete within Adobe Spark, students downloaded their videos and then uploaded them onto a collaborative YouTube Playlist that would house projects for all Forensic Science students at BNHS. By uploading to this platform, students were able to share their creation beyond the walls of their class period and could in turn view documentaries created by students studying the same content in a completely different class period. Publishing to YouTube allowed students to have a broader audience, made the presentation format more engaging as students got to watch multiple mini-documentaries, and created a wealth of examples to draw from for the following school year. Since Mrs. Ainsworth's classes in all had 57 videos on their Playlist, Mrs. Ainsworth plans to pick the top exemplars, as well as non-examples, from this collaborative playlist to make a new, shortened, and focused playlist to support next year's students as they, too, begin this exciting creative project.

This project meets ISTE Student Standard of being a Knowledge Constructor (3) in which students
  • 3a: Students plan and employ effective research strategies to locate information and other resources for their intellectual or creative pursuits.
  • 3b: Students evaluate the accuracy, perspective, credibility and relevance of information, media, data or other resources.
  • 3c: Students curate information from digital resources using a variety of tools and methods to create collections of artifacts that demonstrate meaningful connections or conclusions.


Monday, November 19, 2018

Say “Oui!” to Performance-based Assessments


If you’re anything like I was as a classroom teacher, you’ve spent many nights drowning in papers to grade. You understand the time spent in coffee shops, trying desperately to get caught up. And yet, if you’re anything like me, there have been times that, after all those hours and lattes, you weren’t satisfied that your students’ grades actually reflected their knowledge and ability. Where was I going wrong?

I assigned and graded vocabulary worksheets each week, but students were still scoring low on their diction in writing. I graded reading quizzes that assessed plot and character knowledge, but in the end some students couldn’t talk about the major themes of a novel. Between what felt like wasted class time and weekends spent grading, it never failed that when it turned out an assignment didn't actually tell me whether or not my students truly “got it”, I was left frustrated.

I understood that traditional assignments and tests work to show if students “know” something, but quickly learned that they fall short as an indicator of whether or not students can actually use that knowledge. Of course there is a time and place for each, but it is important for teachers to challenge their students with performance-based assessments if they want to know that students can apply their knowledge in meaningful ways. Northwest High School’s French teacher, Madame Blanc (Mrs. White), made this shift in her classroom this year, away from traditional tests and towards a performance-based method of assessment -- and it seems to be paying off.

Each six weeks, Madame Blanc gives her students both creative tasks and opportunities to apply and demonstrate their learning through student-created products that are ultimately shared through their ePortfolio, a personal and digital collection of their growth and learning. As a basic example, she asked her students to create an article for a French magazine that explains an American holiday and custom as a way to assess their application of many language skills they are working on.

French student Elise Reuman recounted one assignment where she and her classmates were asked to create a video that described their partner’s family as a way to demonstrate their ability to use adjectives in French. Using Adobe Spark video, she described her classmate's family. Elise reflected, “...using the vocabulary in a way that applied it to a likely scenario really helped to ingrain the information. Projects like this usually only require the [written] portion of the vocabulary… [but] Mrs.White, went a step further and required a vocal response as well. This really solidified some of the pronunciation and helped me become more comfortable with actually speaking the French language.”

As Elise shared, performance-based tasks engage students in more authentic opportunities to practice real-world skills. It’s important to note that, in a performance-based classroom “teachers do not have to “give up” units of study or favorite activities” (ASCD). According to ASCD, it’s because these “authentic tasks are rooted in curriculum” that “teachers can develop [assignments] based on what already works for them.” It’s ultimately through small changes in how teachers ask students to learn that “assignments become more authentic and more meaningful to students.”

For example, in another assignment in Madame Blanc's class, students were challenged to learn about multiple perspectives, including the likes and dislikes of French teenagers. They had to go further to compare/contrast these perspectives with those of American Teens. Students interviewed their peers (some opting to collect data through Google Forms), graphed and visualized the data they collected (through Google Sheets), and then wrote of summary of their findings in both French and English, finally sharing their work through their ePortfolio (a website created on Google Sites). Assignments like this require students to be strong in their content knowledge, but more than that, they develop skills outside of French language studies -- skills like the 6 Cs: creativity, communication, collaboration, critical thinking, character education, and citizenship.

Watching performance-based assessments work for Madame Blanc has reiterated what hindsight and experience taught me: It was when I focused on creating rigorous and authentic learning tasks for my students, rather than assigning simple checks-for-understanding for grades, that I best served them. It is through rigorous, performance-based learning tasks that we can empower our students to think critically and create, and that we can most accurately and authentically assess their learning.

Monday, December 18, 2017

Mastering the Madness of Mythology


Mythology is a genre most students enjoy reading and studying, however few truly comprehend.  In order to help students deeply analyze the elements of this genre and demonstrate their understanding of the structure, Mrs. Davis, 7th grade GT ELA teacher at Chisholm Trail Middle School, challenged students to write their own original myth.

Students were asked to collaborate with peers to craft creation myths.  Through each unique tale, students explained how a natural phenomena came to be, while teaching the audience a valuable lesson about the choices we make and the impact they can have.  Students spent a week working through the process described below.  

Planning and Drafting
A key part of this project involved students collaborating on all aspects of the myth.  In order to easily facilitate collaboration, Mrs. Davis shared template resources with students through Google Classroom.  Student groups were then able to access the files from their own Google Drive and work together  to develop a solid plan.  Students also relied on Google Drive as they drafted the first version of their myth.  Google Docs allowed students to simultaneously access the same document so all group members could serve as active participants.  The use of the “History” feature available with this tool enabled the teacher to clearly see the individual contribution of each group member.  This encouraged full participation and aided in the assignment of individual student grades.

Publishing
When it came time to publish, students were given the option of using Adobe Spark Video or Pages.  Spark considers itself, “a one-stop content shop for creating and sharing visual stories that will wow any audience on any device.”  This was the perfect tool for students to blend their text with images, bringing their stories to life!  Click on the images below to see their creations.


Screen Shot 2017-10-25 at 4.06.20 PM.png         Screen Shot 2017-10-25 at 4.07.10 PM.png     
Screen Shot 2017-10-25 at 4.08.21 PM.png       Screen Shot 2017-10-25 at 4.05.06 PM.png


Reflection & Feedback
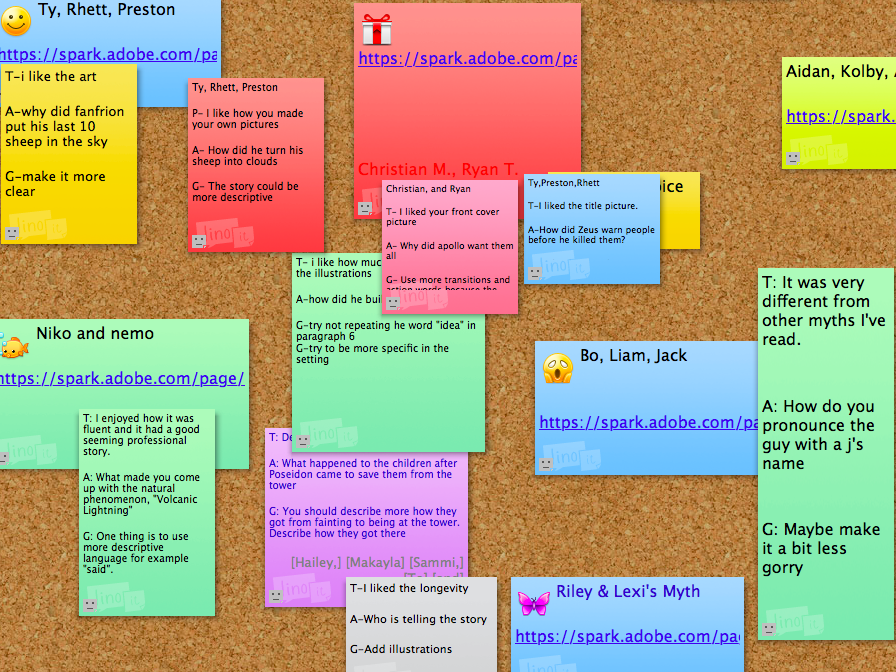
Mrs. Davis utilized Lino sticky canvas for students to provide feedback to one another.  The canvas was created by the teacher and then shared with students.  Each group created a note with their names and a link to their presentation.  Groups were required to view at least 2 projects and use the TAG feedback strategy to provide authentic peer feedback.  The collaborative aspect of Lino allowed all students to view one another’s projects, as well as access the feedback.  While Mrs. Davis was happy with the overall experience Lino provided students, she did mention that she would set things up differently if she utilized the tool again in the future.  She suggests creating the original notes for each groups and then allowing students to comment around them.  This would allow the teacher to lock the notes in place and prevent any confusion caused by a lack of organization.

Screen Shot 2017-10-25 at 11.38.33 AM.png


In years past, students completed this project using paper and art supplies.  It’s always been a project students love, but this year, the integration of technology took things to an entirely new level.  A common frustration reported previously was the limited time students had to complete the myth.  With the use of collaborative tools, students could access their work anytime, anywhere.  The increased accessibility, improved the overall quality of the projects and provided students a deeper understanding of the content.  While all of these benefits make the project worthwhile, the most meaningful benefit would be the ability to instantly provide students with a global audience.  Since the assignment was completed using a digital tool, students were able to link their Adobe Spark Videos or Pages to their ePortfolios.  This will be an experience students can look back on and share for years to come.

Wednesday, November 1, 2017

Advancing Academics: More than Test Prep

As educators focus on growing their Advanced Academics programs and improving AP test scores, too often their conversations begin and end somewhere around “test prep”. While there is value in traditional test prep strategies like multiple choice practice and repetitive text analysis, students also desperately need to be able to think critically and apply their knowledge in meaningful ways.
Northwest High School’s AP World History teachers, Jeanette Jones and Nicole Olson challenged their students to collaboratively depict the effects of historic trade routes based on the five major themes of their AP course. Student Sam clarified, “We were given a map of all of the trade routes …and had to accurately describe the interactions between those empires on an environmental, economic, social, political, and cultural level.” Students worked together to research and create an infographic that compares trade routes and visualizes key points of their research. (You can access the full instructions here.)

Students were given choice in how to create their graphics; however, Jones & Olson specified that students couldn’t use PowerPoint or Slides to create their presentations because while useful, these platforms are too visually limiting for the needs of this assignment. Instead, they recommended Piktochart, a platform designed for creating professional presentations and graphics. (Check out these student examples: Sample: Smore & Sample: Piktochart.)


Student Bailey reflected on how this task prepared her for the AP exam, saying, “Trade routes are a major part of how things got diffused in the world… how language got diffused and cultural trade… those are important things to know for the AP exam because they are such a huge part of history.” She added, “And when I make a presentation for something, I typically try to make myself an expert in it…”

Creating infographics as a way to present research and demonstrate understanding of content engages students in a hands-on, student-centered learning process. Sam points out that, “When [you] read a textbook, you’re just looking for answers to the reading guide or for vocabulary. Having to do a project, to write it down and describe it, you really think about what you’re doing and how you’re learning it”. When students engage in collaborative tasks that require in-depth analysis and critical thinking, they gain sincere ownership of their learning that results in a lasting understanding of content in ways traditional test prep alone cannot provide.